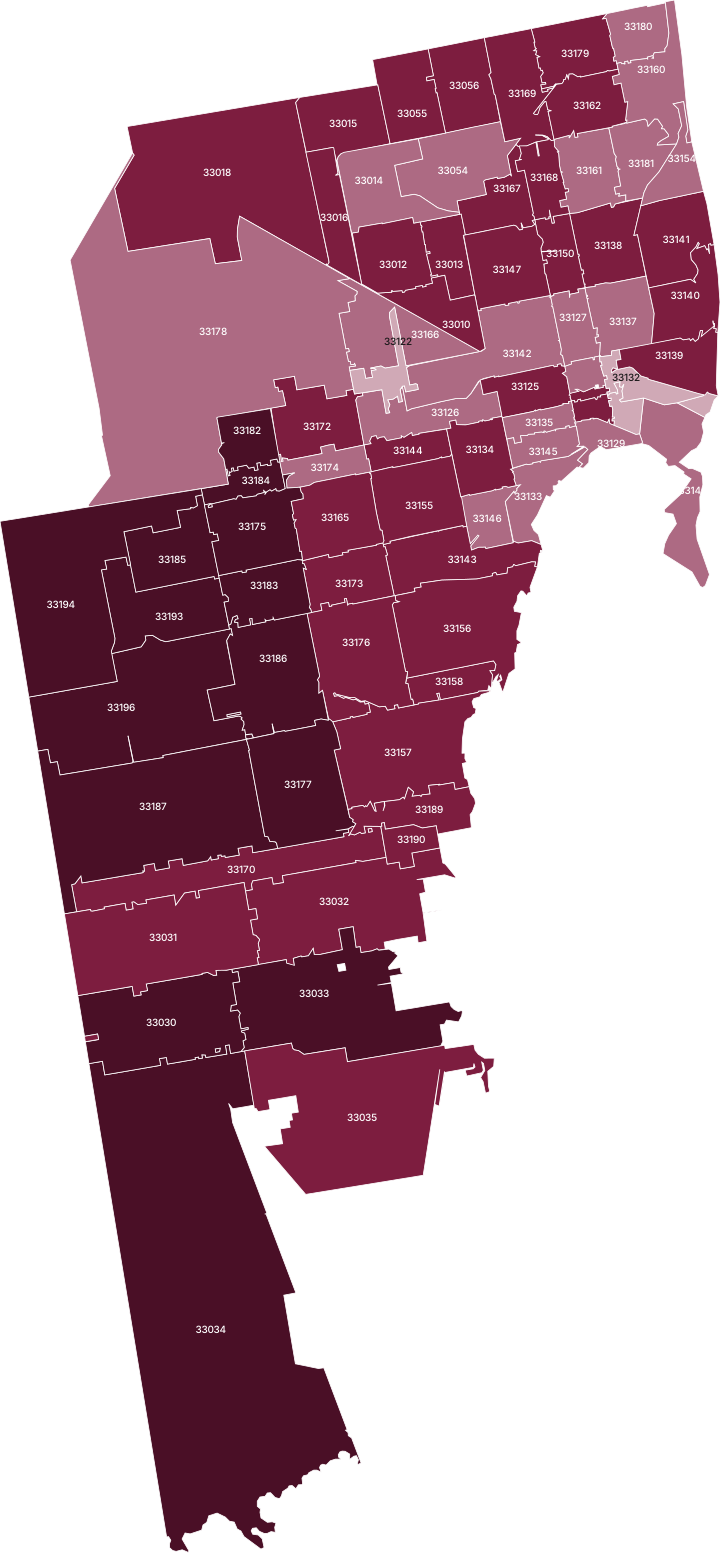
Miami-Dade County property risk by ZIP code
Miami-Dade County has 551,550 buildings across 78 ZIP areas; 39% of them stand in FEMA's high-risk flood zone on the current map, and new flood maps take effect on February 19, 2027.
- County USPR Score
- 68/100
- High, compared with US counties; $165 per $100k a year
- Homes in high-risk flood zone
- 40%
- 199,250 residential structures, FEMA 2026-08-03
- High-risk homes insured (NFIP)
- 74%
- 164,154 residential contracts in force
- Major disaster declarations
- 23
- 13 since 2000; latest Hurricane Milton
All Miami-Dade County ZIP codes ranked
Highest USPR Score first. Select a column to sort.
| 33177 Miami | 86 Very high | 26% | $982 | 0 |
|---|---|---|---|---|
| 33194 Miami | 86 Very high | 43% | $949 | 0 |
| 33196 Miami | 86 Very high | 47% | $984 | 0 |
| 33185 Miami | 85 Very high | 37% | $940 | 0 |
| 33182 Miami | 83 Very high | 17% | $730 | 0 |
| 33184 Miami | 83 Very high | 74% | $863 | 0 |
| 33034 Homestead | 82 Very high | 63% | $1,240 | 0 |
| 33175 Miami | 82 Very high | 64% | $885 | 0 |
| 33183 Miami | 82 Very high | 69% | $916 | 0 |
| 33033 Homestead | 81 Very high | 53% | $1,160 | 1 |
| 33030 Homestead | 80 Very high | 31% | $1,089 | 0 |
| 33186 Miami | 80 Very high | 46% | $972 | 0 |
| 33187 Miami | 80 Very high | 40% | $1,028 | 0 |
| 33193 Miami | 80 Very high | 18% | $907 | 0 |
| 33031 Homestead | 78 High | 61% | $1,037 | 0 |
| 33035 Homestead | 78 High | 63% | $1,238 | 1 |
| 33055 Opa Locka | 75 High | 77% | $546 | 1 |
| 33158 Miami | 73 High | 65% | $2,574 | 0 |
| 33176 Miami | 73 High | 22% | $1,086 | 0 |
| 33018 Hialeah | 72 High | 41% | $538 | 0 |
| 33150 Miami | 72 High | 19% | $876 | 2 |
| 33170 Miami | 72 High | 42% | $933 | 0 |
| 33144 Miami | 71 High | 24% | $913 | 0 |
| 33156 Miami | 71 High | 36% | $2,036 | 0 |
| 33190 Miami | 71 High | 97% | $1,770 | 0 |
| 33179 Miami | 70 High | 25% | $892 | 2 |
| 33015 Hialeah | 69 High | over 99% | $512 | 0 |
| 33139 Miami Beach | 69 High | over 99% | $2,856 | 1 |
| 33140 Miami Beach | 69 High | over 99% | $3,934 | 0 |
| 33167 Miami | 69 High | 10% | $677 | 2 |
| 33013 Hialeah | 68 High | 43% | $623 | 1 |
| 33056 Miami Gardens | 68 High | 50% | $668 | 1 |
| 33138 Miami | 68 High | 37% | $1,440 | 1 |
| 33157 Miami | 68 High | 34% | $1,854 | 0 |
| 33165 Miami | 68 High | 5% | $876 | 0 |
| 33169 Miami | 68 High | 30% | $805 | 2 |
| 33173 Miami | 68 High | 38% | $880 | 0 |
| 33147 Miami | 67 High | 44% | $643 | 2 |
| 33012 Hialeah | 66 High | 45% | $621 | 1 |
| 33032 Homestead | 65 High | 41% | $1,144 | 1 |
| 33141 Miami Beach | 64 High | 98% | $3,718 | 0 |
| 33010 Hialeah | 63 High | 51% | $704 | 1 |
| 33162 Miami | 63 High | 13% | $737 | 1 |
| 33168 Miami | 63 High | 8% | $649 | 2 |
| 33125 Miami | 62 High | 52% | $1,103 | 2 |
| 33143 Miami | 62 High | 19% | $1,252 | 0 |
| 33172 Miami | 62 High | 35% | $773 | 0 |
| 33128 Miami | 61 High | 94% | $1,248 | 0 |
| 33130 Miami | 61 High | 46% | $1,111 | 0 |
| 33155 Miami | 61 High | 11% | $885 | 0 |
| 33016 Hialeah | 60 High | 55% | $559 | 0 |
| 33134 Miami | 60 High | 2% | $1,223 | 1 |
| 33189 Miami | 60 High | 67% | $1,621 | 0 |
| 33178 Miami | 59 Moderate | 20% | $666 | 0 |
| 33161 Miami | 58 Moderate | 57% | $785 | 2 |
| 33174 Miami | 58 Moderate | 78% | $894 | 0 |
| 33014 Hialeah | 57 Moderate | 39% | $548 | 0 |
| 33126 Miami | 55 Moderate | 38% | $921 | 1 |
| 33142 Miami | 55 Moderate | 46% | $814 | 2 |
| 33146 Miami | 55 Moderate | 3% | $1,263 | 0 |
| 33136 Miami | 54 Moderate | 34% | $1,522 | 2 |
| 33166 Miami | 52 Moderate | 41% | $875 | 1 |
| 33181 Miami | 52 Moderate | 85% | $1,389 | 0 |
| 33054 Opa Locka | 50 Moderate | 14% | $588 | 1 |
| 33160 North Miami Beach | 50 Moderate | 80% | $2,479 | 0 |
| 33127 Miami | 49 Moderate | 6% | $817 | 2 |
| 33135 Miami | 49 Moderate | 5% | $1,089 | 1 |
| 33133 Miami | 46 Moderate | 9% | $1,608 | 0 |
| 33145 Miami | 44 Moderate | 0% | $1,234 | 0 |
| 33154 Miami Beach | 44 Moderate | 96% | $3,977 | 0 |
| 33180 Miami | 44 Moderate | 78% | $1,044 | 1 |
| 33129 Miami | 43 Moderate | 5% | $1,126 | 0 |
| 33137 Miami | 42 Moderate | 24% | $1,438 | 1 |
| 33149 Key Biscayne | 41 Moderate | 97% | $4,558 | 0 |
| 33122 Miami | 38 Low | 45% | $745 | 0 |
| 33109 Miami Beach | 35 Low | 86% | — | 0 |
| 33131 Miami | 34 Low | 91% | — | 0 |
| 33132 Miami | 26 Low | 47% | — | 1 |
Not scored: 33039 (Homestead, 0 homes), 33101 (Miami, 1 home). These ZIP areas have too few homes for a meaningful area report.
Highest scores
- 33177 Miami86 · Inland flooding leads
- 33194 Miami86 · Inland flooding leads
- 33196 Miami86 · Inland flooding leads
- 33185 Miami85 · Inland flooding leads
- 33182 Miami83 · Inland flooding leads
Lowest scores
- 33132 Miami26 · Hurricane leads
- 33131 Miami34 · Hurricane leads
- 33109 Miami Beach35 · Hurricane leads
- 33122 Miami38 · Hurricane leads
- 33149 Key Biscayne41 · Hurricane leads
What drives risk in Miami-Dade
In FEMA's National Risk Index, hurricane ($81), inland flooding ($75), coastal flooding ($5) are the largest modelled losses per $100,000 of building value a year across the county. The highest ZIP scores are in South Miami Heights, Miami, The Hammocks, where inland flooding and hurricane lead; the lowest are in Miami, Fisher Island, Doral.
Flood insurance is common: 355,834 NFIP policies were in force in these ZIP areas on August 31, 2026, and the median single-family house policy across ZIP medians was $949 a year.
New flood maps on February 19, 2027
FEMA's final flood hazard determination for Miami-Dade County and its incorporated areas was published in the Federal Register on October 14, 2026 (91 FR 65238, docket FEMA-B-2166). It sets February 19, 2027 as the effective date of the new Flood Insurance Rate Map and Flood Insurance Study. Until then the current maps apply, and every ZIP report on this site uses them. What changes in 2027
Major disaster declarations since 2000
FEMA
| Declaration | Incident | Declared |
|---|---|---|
| Hurricane Milton | Hurricane | October 11, 2024 |
| Hurricane Nicole | Hurricane | December 13, 2022 |
| Hurricane Ian | Hurricane | September 29, 2022 |
| Covid-19 Pandemic | Biological | March 25, 2020 |
| Hurricane Irma | Hurricane | September 10, 2017 |
| Hurricane Wilma | Hurricane | October 24, 2005 |
| Hurricane Katrina | Hurricane | August 28, 2005 |
| Hurricane Jeanne | Hurricane | September 26, 2004 |
| Hurricane Frances | Hurricane | September 4, 2004 |
| Tropical Storm Bonnie And Hurricane Charley | Hurricane | August 13, 2004 |
| Severe Storms And Tornadoes | Severe Storm | April 25, 2003 |
| Severe Freeze | Freezing | February 5, 2001 |
| Severe Storms And Flooding | Severe Storm | October 4, 2000 |
Other county facts
- Radon: EPA Zone 2 on the 1993 county map Moderate predicted indoor levels, 2 to 4 pCi/L
- Residential structures: 492,181 FEMA NFIP penetration-rate table, 2026-08-03
- Residential NFIP take-up, whole county: 33% Share of all residential structures with an NFIP contract
- Our building count in the high-risk zone: 38% of residential buildings FEMA/ORNL USA Structures on the current map; FEMA's own table gives 40%